Wrapper around gtrendsR::gtrends() that modifies the original function by
a) vectorizing it, b) converting the result to tsboxable tibble and c)
retries if no result is returned.
ts_gtrends(
  keyword = NA,
  category = "0",
  geo = "CH",
  time = "today+5-y",
  retry = 5,
  wait = 5,
  quiet = FALSE
)
Arguments
- keyword
A character vector with the actual Google Trends query keywords. Defaults to NA which searches for the whole category. Contrary to
gtrendsR::gtrends(), if different keywords are used, mulitple queries are sent to Google, and each series is individually normalized.- category
A character vector, listing the categories, defaults to
"0". Passed togtrendsR::gtrends()- geo
A character vector denoting geographic regions for the query, default is
"CH". Passed togtrendsR::gtrends()- time
A string specifying the time span of the query. Possible values are:
- "now 1-H"
Last hour
- "now 4-H"
Last four hours
- "now 1-d"
Last day
- "now 7-d"
Last seven days
- "today 1-m"
Past 30 days
- "today 3-m"
Past 90 days
- "today 12-m"
Past 12 months
- "today+5-y"
Last five years (default)
- "all"
Since the beginning of Google Trends (2004)
- "Y-m-d Y-m-d"
Time span between two dates (ex.: "2010-01-01 2010-04-03")
- retry
Number of attempts, in case the query request does not succeed.
- wait
Seconds to wait between attempts, where waiting time is
attempt * wait.- quiet
If TRUE won't display messages related to server interactions. Default is FALSE.
Value
A tibble of time series for the different keywords or categories. If only a single keyword and a single category are specified, the tibble has columns time and value. If either more than one keyword, or more than one category are given, an additional column id indicates either the keyword, or the category.
Notes
The function takes the id's as strings, not the names. For example, "Arts & Entertainment" has to be specified as "2".
Multiple keywords or multiple categories can be specified, but not both.
See also
gtrendsR::gtrends(), browseVignettes("intro")
Examples
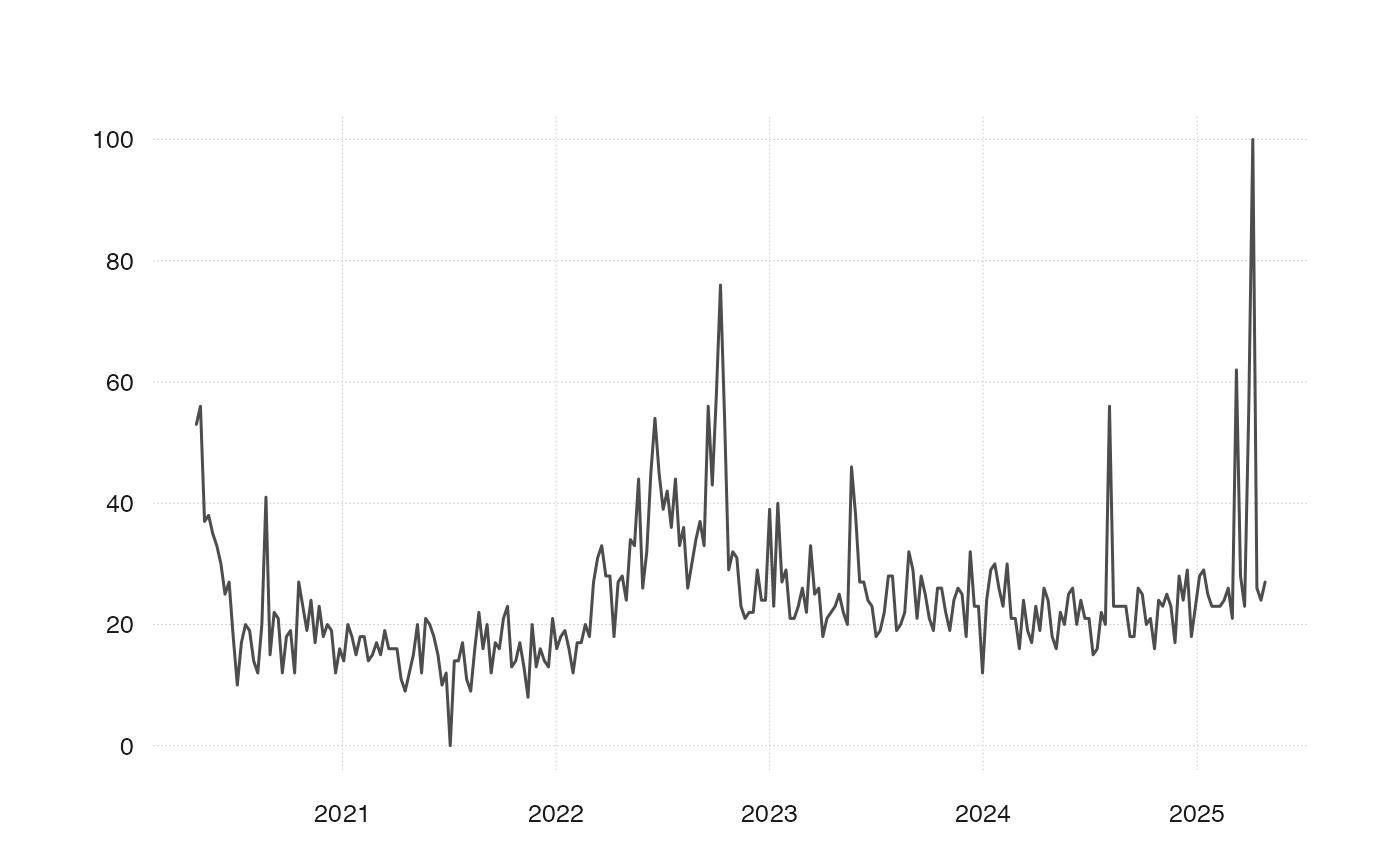
x <- ts_gtrends("Rezession")
#> Downloading data for today+5-y
x
#> # A tibble: 261 × 2
#>    time       value
#>    <date>     <int>
#>  1 2021-05-30    23
#>  2 2021-06-06    19
#>  3 2021-06-13    15
#>  4 2021-06-20     8
#>  5 2021-06-27    11
#>  6 2021-07-04     0
#>  7 2021-07-11    18
#>  8 2021-07-18    11
#>  9 2021-07-25    19
#> 10 2021-08-01    19
#> # ℹ 251 more rows
tsbox::ts_plot(x)